Hopp til innhold

Ruter's Finances and Key Figures

Ruter's purpose is not to generate financial profit for its owners, but to contribute to Oslo Municipality and Akershus County Municipality achieving their transport policy goals.

Woman in winter clothes standing at a bus stop with snowy surroundings and blurred background.

Photo: Ruter As / Nucleus AS, Mathilde Spieler Palmers

Key figures presented in this chapter are related to revenues, costs, subsidies, and production. Key figures have been prepared in total and distributed across the different modes of operation.

Main financial figures

The parent company, Ruter As, had operating revenues of NOK 12,191 million and a profit of NOK 23 million in 2023.

Operating revenues in the Group, which also includes OATS AS, Persveien Eiendom 1 AS, Persveien 23 AS, Persveien 34/36 ANS, and the dormant companies Trafikanten AS, AS Oslo Sporveier and Stor-Oslo Lokaltrafikk a.s, were NOK 12,201 million.

Of the parent company’s operating revenues, ticket revenues and sales of services to Oslo Municipality and Viken County Municipality account for NOK 4,740 million, NOK 3,763 million, and NOK 1,338 million, respectively.

The sale of services to Oslo Municipality and Viken County Municipality finances 42% of public transport in the region. Including the operational portion of Oslo Package 3 and the state incentive scheme, 51% is financed with county and state funds.

The purchase of services from the owners has been a prerequisite for Ruter to maintain normal operations in a year where costs have risen more than revenues.

The total operating costs for the parent company were NOK 12,236 million. Of this, NOK 10,825 million represents costs for the purchase of services and route operations. The Group’s operating costs amount to NOK 12,238 million. The financial results are otherwise described in detail in the Board of Directors’ annual report.

Ticket inspections should not generate a profit

Ruter has never made money from ticket inspections. It is not, and has never been, a goal. Ticket inspections are a good and inexpensive tool that helps ensure more people pay for the service they use. Ticket revenues are absolutely crucial for public transport. They provide Ruter, along with public subsidies, the means to operate and further develop the public transport system.

During the pandemic, ticket inspections were suspended due to infection control concerns. This became clear evidence of the effect of a lack of control. Many people chose not to pay for a ticket when they had to travel by public transport, resulting in significant losses for the public transport system.
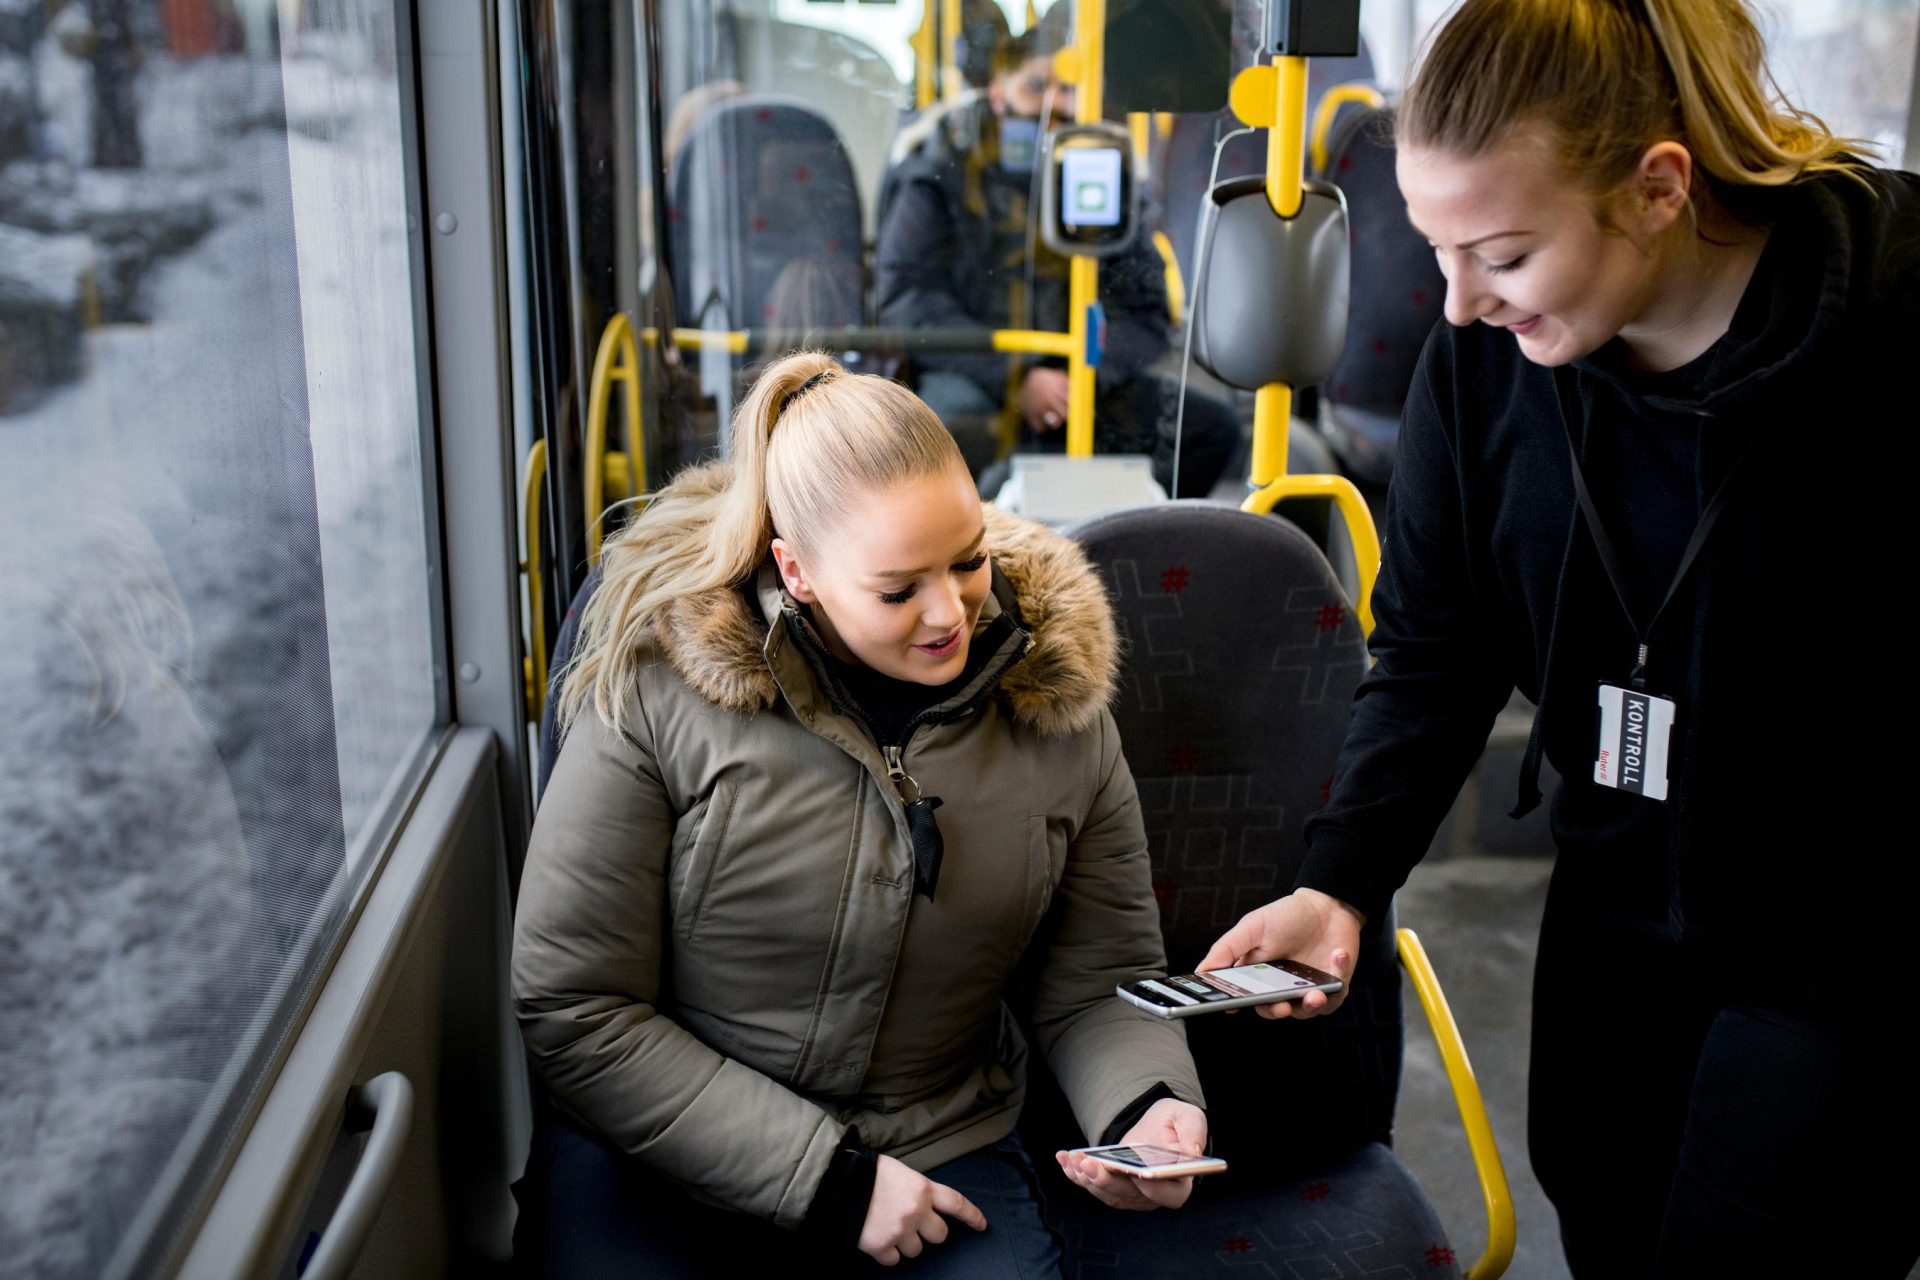
Ticket inspector checks a female passenger's ticket on a bus, with other travelers visible in the background.

Photo: Ruter As / Fartein Rudjord

NOK 0 million

Fines issued in 2023

NOK 0 million

Ticket inspection expenses in 2023

NOK 0 billion

Total ticket revenue in 2023

Sharp decline in payment rates during the pandemic

*In 2020, all point measurements were canceled due to the coronavirus pandemic, therefore payment rate figures are missing

Measures

  • Significant increase in the number of passengers checked
  • Improved signage indicating that a valid ticket is required before boarding
  • Information about zones displayed on onboard screens
  • Additional communication measures on dedicated screens at Løren and Tøyen subway stations

Development of subsidies 2019-2023

Key figures

All financial figures are adjusted to 2023 values.

Revenues

The revenue per trip (including trains) in 2023 was NOK 13.13.
Ticket revenue per trip varies, and regional buses, boats, and trains, with journeys often extending over several zones, naturally have the highest revenue per trip.

In 2023, the revenue was highest for regional buses at NOK 13.93 per trip. Next was NOK 12.85 for boat trips, NOK 10.00 for tram trips, NOK 9.95 for subway trips, and NOK 9.91 for city bus trips.

Trips by subway, tram, and city bus mainly take place within a single zone, which explains the lower revenue per trip. The highest revenue per trip goes to trains, which are currently operated by the Vy Group; the revenue in 2023 was NOK 30.05 per trip.

Efficiency

The cost per trip (excluding trains) in 2023 was NOK 32.18, a decrease from NOK 34.87 in 2022. This corresponds to a reduction of 7.7%. To measure the efficiency of the service, Ruter looks at, among other things, the development in costs per seat kilometer (which is the capacity offered).


Subsidies

Ruter paid an average of NOK 30.05 per trip to Vy in total from ticket revenues and price subsidies. State service purchases are in addition for train traffic and provide the basis for covering a cost that is significantly higher than what Ruter pays.

Ruter´s traffic area

2023202220212020201920182017201620152014201320122011201020092008
OPERATIONAL KEY FIGURES
Trips (millions)*386341246240398387371350334319309300285271256244
Passenger kilometers (millions)**1562142213981313236522952201203318981830175917191636152614331350
Vehicle kilometers (millions)127,2128,8129,1124,3122,2119,7113,0106,197,293,690,585,382,178,373,873,2
Seat kilometers (millions) 12213123361236611960107281065210244956585628275786873366981648659485854
Departures (thousands)5912582758465669556252444885443243834089399137413605352734403473
Occupancy rate (seats)**13 %12 %11 %11 %22 %22 %21 %21 %22 %22 %22 %23 %23 %24 %24 %23 %
 
FINANCIAL KEY FIGURES
Traffic revenue (millions)5069492434583462560154405227496847704445420840234050397038373866
Subsidies (millions)6225607774457165459544384444424942404135395637603563333331472663
Costs (millions)***1234111907115871117910850102739447931593308809846579877737743271106639
 
Operating profit (millions) -45,0-140,456,7-83,9-216,4-70,1561,2185,8-28,050,8-15,4-22,819,40,3-10,1-32,5
Profit after extraordinary items (millions)23,0-89,776,2-63,5-170,2-38,1605,1226,29,888,06,81,98,84,11,40,2
 
Debt ratio 79 %76 %73 %73 %71 %67 %71 %82 %89 %89 %89 %84 %85 %85 %80 %70 %
Solvency21 %25 %27 %27 %29 %33 %29 %18 %11 %11 %11 %17 %15 %15 %20 %30 %
Liquidity ratio1,141,141,241,261,211,521,461,221,131,211,191,231,281,251,231,27
 
Traffic revenue/trip (incl. trains)13,1314,4314,0414,4014,0614,0614,0814,1814,2713,9213,6213,4214,1914,6714,9715,85
Costs/trip (excl. trains)32,1834,8746,3245,5427,1026,2925,4326,2227,0927,7727,2626,6627,0826,9927,6727,06

Financial figures are adjusted for the consumer price index.
* The number of trips includes trains. Production data excludes trains.
** The method for calculating passenger kilometers has changed from 2022. The figures are therefore not comparable with previous years. For conversion factors, see the 2022 annual report.
*** Costs including traffic advertising directly to Sporveien.

2023202220212020201920182017201620152014201320122011201020092008
OPERATIONAL KEY FIGURES
Trips (millions)1111017374,31191221181069588858281767473
Passenger kilometers (millions)590543421401717731706636570525508492484456446437
Vehicle kilometers (millions)44,445,745,745,644,845,645,142,034,835,233,230,228,925,121,921,5
Train kilometers (millions)8,78,98,88,88,78,98,78,47,37,16,86,16,15,75,75,9
Seat kilometers (millions) 5905607960766069596360645997559246334679441140223842334128712769
Occupancy rate (seats)10 %9 %7 %7 %12 %12 %12 %11 %12 %11 %12 %12 %13 %14 %16 %16 %
Departures (thousands)381386381375372373378363338324288289287257269263
Train hours (thousands)286290291289286287281270242237279260246222219234
Travel speed km/h30,430,530,630,630,530,931,131,030,230,130,131,231,332,131,231,7
Route length km85,685,685,685,685,685,685,685,68185828180787176
 
Energy consumption per passenger km0,180,200,270,260,140,140,140,160,150,170,170,160,160,160,160,18
 
FINANCIAL KEY FIGURES
Traffic revenue (millions)1108112781184913251344130611911059958923889862877903870
Subsidies (millions)779850103710885806136677509361032955938957885698589
Costs (millions)*1986209119302007201520642078203420942094198118781855179416331496
 
Internal Efficiency:
Cost/departure5219541750635352542055325493560361976466687764986453697660685679
Cost/seat km0,340,340,320,330,340,340,350,360,450,450,450,470,480,540,570,54
 
External Efficiency:
Traffic revenue/trip9,9511,2111,1711,4111,1011,0311,1011,2311,1610,9410,9010,8310,6911,5512,1511,95
Traffic revenue/passenger km1,882,081,932,111,851,841,851,871,861,821,821,811,781,932,021,99
Traffic revenue/seat km0,190,190,130,140,220,220,220,210,230,200,210,220,220,260,310,31
Cost/trip17,8420,8026,5927,0016,8716,9517,6719,1722,0523,9223,3822,8922,9923,6321,9720,54
Cost/passenger km3,373,854,585,002,812,822,953,203,683,993,903,813,833,943,663,42

Efficiency data only includes Ruter As’ accounted costs.
Thus, the capital cost for infrastructure and rolling stock is largely excluded.
Financial figures are adjusted for the consumer price index.
* Costs incl. traffic advertising directly to Sporveien (100.1 million in 2023).

2023202220212020201920182017201620152014201320122011201020092008
OPERATIONAL KEY FIGURES
Trips (millions)48422822535151535451494848454340
Passenger kilometers (millions)1011006651169165165170174163158153153145137127
Vehicle kilometers (millions)4,74,84,74,54,64,74,44,34,24,03,94,14,04,03,94,0
Seat kilometers (millions)728706695668683686651635614600572593571577568585
Occupancy rate (seats)14 %14 %10 %8 %25 %24 %25 %27 %28 %27 %28 %26 %27 %25 %24 %22 %
Departures (thousands)483421425429464462464392379373360363360366367355
Vehicle hours (thousands)254255255243258252236234229216289304294294285287
Travel speed km/h18,518,718,518,617,918,518,818,418,319,019,019,019,018,317,818,0
Route length km40404040404041434341404141413941
 
Energy consumption per passenger km0,310,360,330,450,140,140,120,120,130,120,120,150,140,160,190,22
 
FINANCIAL KEY FIGURES
Traffic revenue (millions)479465300252588565570601605554535514486499487501
Subsidies (millions)754745869895512520492434409455486484509431445466
Costs (millions)*1238121611751149110610901069104410241020103310061003938940975
 
Internal Efficiency:
Cost/departure2566288927642682238323582302266326992731286727702788256725632744
Cost/seat km1,701,721,691,721,621,591,641,641,671,701,811,701,761,631,651,67
 
External Efficiency:
Traffic revenue/trip10,0011,2010,8511,3311,1510,9811,0911,3411,1010,8610,8610,7710,1411,0311,3812,61
Traffic revenue/passenger km4,764,654,524,933,483,433,463,543,473,393,393,373,173,453,563,94
Traffic revenue/seat km0,660,660,430,380,860,820,880,950,980,920,940,870,850,860,860,86
Cost/trip25,8729,2842,4551,7220,9821,1920,7919,6818,7920,0020,9621,0720,9520,7621,9724,53
Cost/passenger km12,3212,1617,6922,496,566,626,506,155,876,256,556,586,556,496,867,66

Efficiency data only includes Ruter As’ accounted costs.
Thus, the capital cost for infrastructure is largely excluded.
Financial figures are adjusted for the consumer price index.
* Costs incl. traffic advertising directly to Sporveien (5.2 million in 2023).

2023202220212020201920182017201620152014201320122011201020092008
OPERATIONAL KEY FIGURES
Trips (millions)180159120118180168159147141139136133126119109101
Passenger kilometers (millions)*84875989584514541375130812001127111710931074999926851786
Vehicle kilometers (millions)77,778,078,473,872,469,163,259,457,954,153,451,049,249,248,147,7
Seat kilometers (millions)**543054045 4615 091393637643461322032002891288527212568256725092500
Occupancy rate (seats)16 %14 %16 %17 %37 %37 %38 %37 %35 %39 %38 %39 %39 %36 %34 %31 %
Departures (thousands)500249754 9974 821467843603996363436243355334330892958290428042855
Bus hours (thousands)277728382 8372 681263824802252213620911951231621892137213420852049
Travel speed km/h28,027,527,627,527,427,828,027,827,727,7
 
Energy consumption per passenger km*0,380,440,400,410,250,270,230,270,280,270,260,270,300,310,330,35
Fossil CO2 emissions kg/per passenger km*0,060,070,020,030,030,040,030,040,050,060,060,060,060,070,080,09
NOX emissions g/per passenger km*0,020,060,080,130,200,160,130,170,210,240,240,290,460,570,690,88
PM10 emissions incl. road dust g/per passenger km*0,0010,0020,0020,0030,0030,0010,0010,020,020,020,020,020,020,020,030,03
 
FINANCIAL KEY FIGURES
Traffic revenue (millions)2039184713921411229021532051183017831731165016081601145713831440
Subsidies (millions)2679260830262945176614181251129513071278125812441099108611321034
Costs (millions)4730447544424378408135963330315131143032294028652717255725292490
 
Internal Efficiency:
Cost/departure946899889908872825833867859904879928919880902872
Cost/seat km0,870,830,810,861,040,960,960,980,971,051,021,051,061,001,011,00
 
External Efficiency:
Traffic revenue/trip11,3211,6011,5712,0012,7412,8312,9212,4612,6712,4112,1412,0712,7112,2212,6314,23
Traffic revenue/passenger km*2,412,431,561,671,571,571,571,521,581,551,511,501,601,571,631,83
Traffic revenue/seat km0,380,340,250,280,580,570,590,570,560,600,570,590,620,570,550,58
Cost/trip26,2728,1136,9237,2122,7121,4320,9721,4522,1321,7421,6421,5121,5721,4523,1024,60
Cost/passenger km*5,585,904,965,182,812,622,552,632,762,712,692,672,722,762,973,17

Financial figures are adjusted for the consumer price index.
* The method for calculating passenger kilometers for regional buses has changed from 2022. The figures are therefore not comparable with previous years. For conversion factors, see the 2022 annual report.
** Seat kilometers from 2020. Seat kilometers until 2019.

2023202220212020201920182017201620152014201320122011201020092008
OPERATIONAL KEY FIGURES
Trips (millions)117102757511510699939291888683817469
Passenger kilometers (millions)385337263257554508477447440436422413399387356330
Vehicle kilometers (millions) 28,327,427,426,626,925,123,422,423,221,021,621,020,521,420,920,5
Seat kilometers (millions)2145203919671913189017871670155516401398145513711278131812861277
Occupancy rate (seats)18 %17 %13 %13 %29 %28 %29 %29 %27 %31 %29 %30 %31 %29 %28 %26 %
Departures (thousands)2420231422922343236021601966184219361729181017161754178517221703
Bus hours (thousands)12651261124812001221113110389881010917132412541251128312461223
Travel speed km/h22,421,722,022,122,022,222,522,723,022,924,625,225,324,625,025,0
 
Energy consumption per passenger km0,270,410,610,620,310,340,280,340,340,330,330,340,320,350,370,37
Fossil CO2 emissions kg/per passenger km0,010,030,050,070,040,040,040,060,070,070,050,080,070,080,090,09
NOX emissions g/per passenger km0,020,100,220,230,190,150,200,270,270,220,370,580,760,800,95
PM10 emissions incl. road dust g/per passenger km0,0010,0020,0030,0030,0030,0010,020,020,020,020,020,020,020,020,03
 
FINANCIAL KEY FIGURES
Traffic revenue (millions)1156113984084812671173110210701024994948915888799735810
Subsidies (millions)94682610481144679500446397446441440481440463518441
Costs (millions)2112198219092011196716951572148914901453141314041340127012611260
 
Internal Efficiency:
Cost/departure873857833858833785800808769840781818764712732740
Cost/seat km0,980,970,971,051,040,950,940,960,911,040,971,021,050,960,980,99
 
External Efficiency:
Traffic revenue/trip9,9111,1411,1811,2110,9811,0811,0811,4911,1710,9410,7710,6410,699,909,9111,79
Traffic revenue/passenger km3,003,383,193,302,292,312,312,392,332,282,242,222,232,062,062,46
Traffic revenue/seat km0,540,560,430,440,670,660,660,690,620,710,650,670,700,610,570,63
Cost/trip18,1019,3825,4026,6017,0416,0115,8115,9916,2615,9916,0616,3216,1215,7317,0118,35
Cost/passenger km5,485,887,267,823,553,343,293,333,393,333,353,403,363,283,543,82

Financial figures are adjusted for the consumer price index.

2023202220212020201920182017201620152014201320122011201020092008
OPERATIONAL KEY FIGURES
Trips (millions)63574542646259544949484743383533
Passenger kilometers (millions)*462421632588900867831753687681671661600539495456
Vehicle kilometers (millions)49,450,651,047,245,543,939,837,034,733,231,830,028,727,827,227,2
Seat kilometers (millions) **3285336534943178204719771790166515621493143013501290124912231223
Occupancy rate (seats)14 %13 %18 %19 %44 %44 %46 %45 %44 %46 %47 %49 %46 %43 %40 %37 %
Departures (thousands)2583266127052478231822012030179216901625153313731204111910821151
Bus hours (thousands)1512157715891481141713491214114810821035992936885851838826
Travel speed km/h32,732,132,131,932,132,632,832,232,132,132,032,132,432,632,432,9
 
Energy consumption per passenger km0,470,470,310,310,220,230,200,220,240,230,220,230,280,280,300,33
Fossil CO2 emissions kg/per passenger km *0,090,100,010,010,020,060,030,030,040,050,070,060,060,070,070,08
NOX emissions g/per passenger km *0,020,020,020,090,210,130,150,210,220,280,240,390,430,610,82
PM10 emissions incl. road dust g/per passenger km *0,0020,0020,0010,0020,0030,0010,020,020,020,020,020,020,020,030,04
 
FINANCIAL KEY FIGURES
Traffic revenue (millions)8827085525631023981948760759737702693713658648631
Subsidies (millions)17331782197818001087918805897861837818764659624613592
Costs (millions)2618249325332366211419021758166216241579152714621377128712681230
 
Internal Efficiency:
Cost/departure101493793795591286486692796197299610641144115011711068
Cost/seat km **0,800,740,720,741,030,960,981,001,041,061,071,081,071,031,041,01
 
External Efficiency:
Traffic revenue/trip13,9312,4312,2313,4115,9115,8315,9814,1315,4715,1614,6614,6716,6417,1018,3519,37
Traffic revenue/passenger km *1,911,680,870,961,141,131,141,011,101,081,051,051,191,221,311,38
Traffic revenue/seat km **0,270,210,160,180,500,500,530,460,490,490,490,510,550,530,530,52
Cost/trip41,3343,7956,0956,3332,9030,7129,6230,8933,1032,4731,8630,9532,1533,4535,8837,76
Cost/passenger km *5,665,924,014,022,352,192,122,212,362,322,282,212,302,392,562,70

Financial figures are adjusted for the consumer price index.
* The method for calculating passenger kilometers for regional buses has changed from 2022. The figures are therefore not comparable with previous years. For conversion factors, see the 2022 annual report.
** Seat kilometers in 2020. Seat kilometers until 2019.

2023202220212020201920182017201620152014201320122011201020092008
OPERATIONAL KEY FIGURES
Trips (millions) *4,03,62,62,64,354,43,94,64,44,24,44,54,44,24,14,0
Passenger kilometers (millions)24211515,625,724,722,927,426,724,624,425,224,322,922,621,8
Boat kilometers (millions)0,360,360,360,350,380,350,330,310,310,260,300,300,280,290,290,30
Seat kilometers (millions)151147134133145139135118113106113114110112103113
Occupancy rate (seats)16 %14 %11 %12 %18 %18 %17 %23 %24 %23 %22 %22 %22 %20 %22 %19 %
Departures (thousands)46,945,343,044,547,948,345,743,442,037,3
Boat hours (thousands)21,120,621,121,123,521,719,817,517,316,2
 
Energy consumption per passenger km0,720,921,271,521,291,151,441,081,151,151,131,131,031,301,141,05
Fossil CO2 emissions kg/per passenger km0,110,150,220,280,290,250,300,230,250,250,240,240,250,310,280,28
NOX emissions g/per passenger km *1,291,962,302,072,262,122,122,112,242,593,534,70
PM10 emissions g/per passenger km0,040,040,040,040,040,040,040,050,050,05
 
FINANCIAL KEY FIGURES
Traffic revenue (millions)51433135656469626561616271838679
Subsidies (millions)2061892322281881831701851921581371331081038573
Costs (millions)258232263263253247239248257219198195179187171151
 
Internal Efficiency:
Cost/departure5490512761155915527750995244570261185886
Cost/seat km1,701,581,961,981,741,781,772,112,272,071,751,711,641,661,661,33
 
External Efficiency:
Traffic revenue/trip12,8512,0911,9913,3714,8714,5517,6713,6514,7514,4513,7313,8416,3019,8720,7919,57
Traffic revenue/passenger km2,192,052,062,252,522,573,022,282,452,482,492,452,923,643,793,60
Traffic revenue/seat km0,340,290,230,260,450,460,510,530,580,570,540,540,650,740,830,69
Cost/trip64,3065,33101,19100,1958,0556,3461,0654,1457,9452,0544,6043,6841,1444,4641,4337,71
Cost/passenger km10,9411,0617,4116,829,849,9610,459,039,648,938,107,737,388,147,566,93

Financial figures are adjusted for the consumer price index.
* NOX emissions g/per passenger km in 2022 have been revised.

2023202220212020201920182017201620152014201320122011201020092008
OPERATIONAL KEY FIGURES
Trips (millions) *3,02,72,02,153,53,23,13,83,73,53,43,53,43,23,13,0
Passenger kilometers (millions)20,318,613,214,122,921,020,224,924,323,122,223,322,320,720,519,7
Boat kilometers (millions)0,270,280,280,270,290,270,260,240,250,220,210,210,200,200,200,21
Seat kilometers (millions)1191211141141251181171009995959693968695
Occupancy rate (seats)17 %15 %12 %12 %18 %18 %17 %25 %25 %24 %23 %24 %24 %22 %24 %21 %
Departures (thousands)35,236,034,235,335,635,333,631,634,028,828,428,427,227,227,427,0
Boat hours (thousands)7,713,713,413,516,114,012,910,911,010,811,710,611,610,214,612,9
 
Energy consumption per passenger km0,750,921,321,571,351,241,511,091,171,151,151,131,021,321,151,05
Fossil CO2 emissions kg/per passenger km0,120,170,240,310,330,250,300,230,250,250,240,240,250,310,290,28
NOX emissions g/per passenger km1,491,952,662,071,862,031,961,871,831,972,333,384,67
PM10 emissions g/per passenger km0,050,040,040,040,040,040,040,050,050,05
 
FINANCIAL KEY FIGURES
Traffic revenue (millions)42342529565160545753505260636658
Subsidies (millions)14615217817713813612313914312011111085907364
Costs (millions)187186202206194187184193200174161162145153139122
 
Internal Efficiency:
Cost/departure5325516359085828543552925474609258976044567456865309563050634514
Cost/seat km1,581,541,771,801,551,581,581,932,021,821,691,681,561,601,611,28
 
External Efficiency:
Traffic revenue/trip13,9512,4712,2413,4915,9316,0119,6214,2415,5115,2014,7014,7017,6120,0021,0919,42
Traffic revenue/passenger km2,051,841,862,052,422,442,992,172,362,312,242,242,683,043,212,96
Traffic revenue/seat km0,350,280,220,250,440,430,520,540,580,560,520,540,640,660,770,61
Cost/trip62,9067,64100,4395,9155,5358,5559,7650,8354,0749,4547,7245,5942,7148,4244,4340,74
Cost/passenger km9,259,9915,2914,608,458,919,107,748,237,537,266,946,507,376,766,20

Financial figures are adjusted for the consumer price index.
* NOX emissions g/per passenger km in 2022 have been revised.

2023202220212020201920182017201620152014201320122011201020092008
OPERATIONAL KEY FIGURES
Trips (millions)1,00,80,60,50,91,20,80,80,70,71,10,91,01,01,01,0
Passenger kilometers (millions)3,32,61,91,52,83,82,72,52,41,52,21,92,02,22,12,1
Boat kilometers (millions)0,090,080,080,080,080,090,080,070,060,040,090,090,080,080,080,09
Seat kilometers (millions)32262018202018171410181817171718
Occupancy rate (seats)10 %10 %9 %8 %14 %19 %15 %14 %17 %14 %12 %11 %12 %13 %12 %12 %
Departures (thousands)11,79,38,89,112,313,112,111,88,18,5
Boat hours (thousands)7,76,97,67,67,47,77,06,66,35,4
 
Energy consumption per passenger km0,510,970,911,080,730,670,880,920,971,000,971,151,101,071,051,05
Fossil CO2 emissions kg/per passenger km0,000,000,040,000,000,000,000,000,250,260,250,300,290,280,280,27
NOX emissions g/per passenger km0,052,033,984,144,584,704,565,415,195,054,964,94
PM10 emissions g/per passenger km0,040,040,060,060,060,070,060,060,060,06
 
FINANCIAL KEY FIGURES
Traffic revenue (millions)109669139887111011202020
Subsidies (millions)6038545150474746493825242314129
Costs (millions)70466157596056555745373334343229
 
Internal Efficiency:
Cost/departure5985498869256252482045784604465770465350
Cost/seat km2,171,783,053,142,992,933,053,154,024,352,041,882,032,011,861,61
 
External Efficiency:
Traffic revenue/trip9,6410,7911,1112,8210,6310,6210,6010,8110,9110,6910,6210,5311,7319,4719,8720,04
Traffic revenue/passenger km3,013,353,474,013,323,323,313,383,415,095,065,025,589,279,469,54
Traffic revenue/seat km0,310,340,330,340,470,620,490,480,570,710,630,540,671,211,151,12
Cost/trip68,3857,46103,82119,3768,1750,4065,7570,1477,3965,1534,6136,3135,6432,4632,1028,77
Cost/passenger km21,3717,8432,4537,3021,3015,7520,5521,9224,1831,0216,4817,2916,9715,4515,2913,70

Financial figures are adjusted for the consumer price index.
* NOX emissions g/per passenger km in 2022 have been revised.

2023202220212020201920182017 *201620152014201320122011201020092008
OPERATIONAL KEY FIGURES
Total train trips (millions)42,7336,3223,0523,6442,1541,539,439,939,637,134,632,326,526,025,626,1
Train trips Akershus/cross-border (millions)33,8828,9518,3118,6133,1132,430,530,730,428,026,224,421,220,820,520,8
Train trips Oslo (millions)8,857,374,745,039,049,18,99,29,29,18,57,85,45,35,15,2
 
FINANCIAL KEY FIGURES
Revenue distribution11571180115611451145106910299591026876824765791749766723
Price difference (in thousands)12791939111889891531821561281213772716
Total revenue guarantee and price difference (in thousands)1284127112491237126311581118111212081032952886828756793739
Revenue distribution and price difference/trip30,0534,9954,2052,3229,9727,9028,3627,8530,5027,8327,4927,4431,2129,0430,9328,38